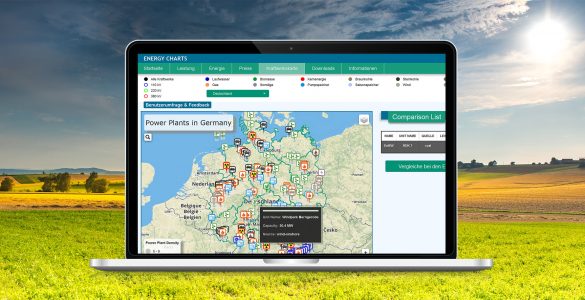
Since 2014 Fraunhofer ISE maintains the Energy Charts portal (www.energy-charts.de) which displays current energy data visually in interactive graphs and diagrams. With just a few clicks, one can view illustrative...
Since 2014 Fraunhofer ISE maintains the Energy Charts portal (www.energy-charts.de) which displays current energy data visually in interactive graphs and diagrams. With just a few clicks, one can view illustrative...


Copyright © 2024 · Fraunhofer ISE · Powered by WordPress