
Since 2014 Fraunhofer ISE maintains the Energy Charts portal (www.energy-charts.de) which displays current energy data visually in interactive graphs and diagrams. With just a few clicks, one can view illustrative diagrams that provide information about the share of renewable energies in the power supply in Germany. Prof. Bruno Burger is the initiator and developer of the Energy Charts. We spoke with him about the project and the newest developments.
Innovation4E:
Prof. Burger, the Energy Charts have been available for three years now. Can you give us a short review on the development and resonance of this unique portal?
Prof. Burger:
In July 2014 we put the Energy Charts online and since then, have continued to develop them further. At the beginning, only the produced power, the type of energy source and the exchange price were shown in the diagrams. Later we added the installed powers, import and export, foreign trade balance, pie diagrams and the generation per plant. We received a lot of positive feedback on the Energy Charts. The number of visitors to the site has continually increased. In 2016, we have over 400,000 visitors and over a million page hits.
Time and again you mention interesting phenomena that has been made visible through the Energy Charts. Can you give us a recent example of this? Perhaps from the 2016 annual summary?
Since 2012 we have been reaching new records for electricity export every year. In 2016, our export balance was over 50 TWh. This is equivalent to the annual electricity generation of five nuclear power plants. In spite of the growth in new capacity in 2016, solar and wind produced less electricity than in 2015. This was due mainly to the weather conditions. The price on the exchange is also an important factor. Since 2011, the prices have fallen continuously and in 2011 reached 28.57 €/MWh, or 2.86 €-cts/kWh.
What important target groups do the Energy Charts address? Which are most active on your site?
The Energy Charts are used by many important groups. Because we do not track our users, I cannot say what type of groups use the portal the most. Many inquiries about the site come from students, PhD students and also politicians and the press. We also publish the current diagrams from the Energy Charts on Twitter so that not everyone has to visit the site every day in order to see if anything new or exciting has happened in the energy sector. On Twitter we have followers from many different groups: journalists, politicians, environmental groups and organizations, energy suppliers, municipal utilities, research institutes, universities and many more.
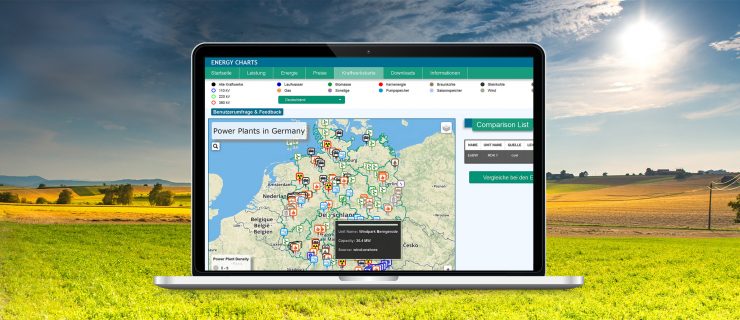
The Energy Charts now have a new feature: a map showing the location and details of the large German power plants. What type of power plants are shown on the map?
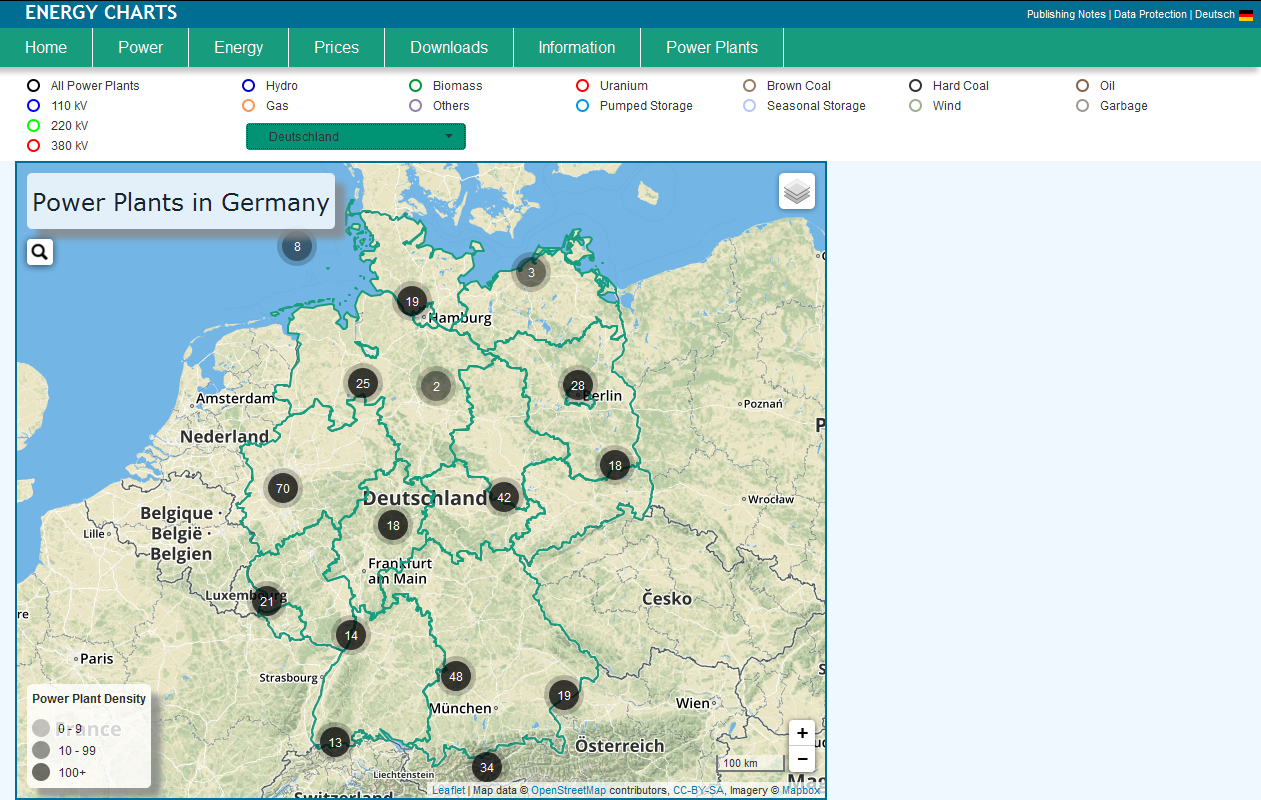
The map shows the location of all 380 power plants that are listed on the European Energy Exchange EEX. The following types of power plants can be selected in the legend: nuclear (uranium), brown coal, hard coal, gas, water, biomass, wind and pumped storage.
What new information does the new feature provide?
If one clicks on the power plant symbol, then the technical data of the selected power plant is shown as follows: name and number, energy source, power, date put into operation and the operating company. The map of power plants in Germany is linked directly to the Energy Charts. With a mouse click, one lands by the Charts and can view the current hourly power plant generation.
The new search possibility was created in cooperation with the University of Stuttgart. Can you describe the cooperation?
The new power plant map was developed as part of a Master’s thesis that was supervised by Prof. Weiskopf and his colleagues at the University of Stuttgart Visualization Research Center (VISUS). The expertise in the area of computer science and visualization as well as many ideas, e.g. a tabular comparison of the power plants came from the faculty at Stuttgart.
What projects / goals does Fraunhofer ISE have in mind for the Energy Charts in the future?
We want to continue with the consequent development of the Energy Charts in order to assert its technological advantage also in the future. To do this, we will create further relevant graphs and look at different possibilities for analysis. In parallel, we want to simply the operation, make it easier to export graphs and also increase the compatibility with different browsers and end devices such as mobile phones, tablets and work stations. The actual goal of the Energy Charts is to provide a fundamental data basis for discussions on the energy transformation. We want to enable discussions that are based on facts. The data also allows us to document the current status and measure the success of the energy transformation.


Please,what are the equipment to test your solar panel efficiency,inverter,solar controller and the battery for their operational efficiency and the bad once among them after several use.
Dear Olakojo Oluwadare,
you can find a range of testing laboratories at our institute’s website: https://www.ise.fraunhofer.de/en/rd-infrastructure/accredited-labs.html