
As part of a research project, Dr. Sven Killinger developed a forecasting model that provides grid operators with data on the power output of PV systems in real-time. In the interview, he explains how it works.
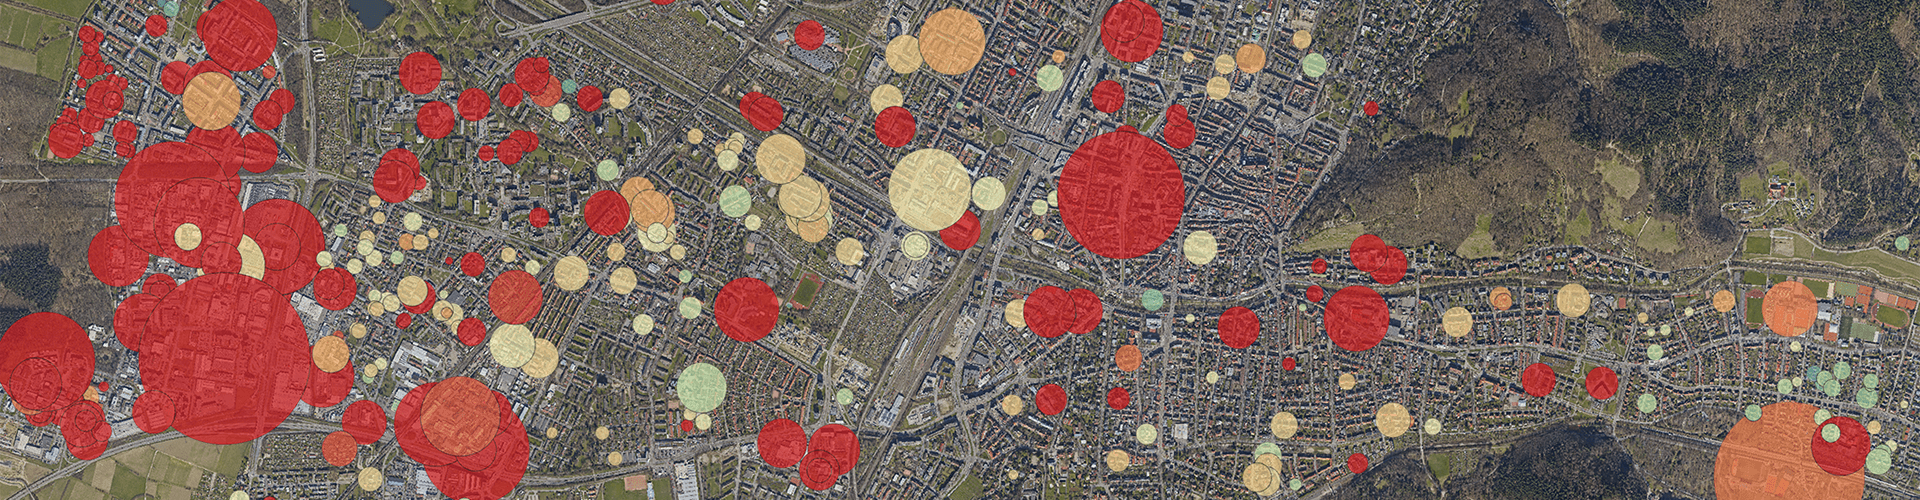
The cover of the Fraunhofer ISE’s newly released annual report shows a satellite image of a city with various differently colored circles. What does that all mean? Looking closer, one recognizes the City of Freiburg, yet what are the circles for? To find that out, we spoke with Dr. Sven Killinger, researcher in the Department of Smart Grids at Fraunhofer ISE.
Innovation4E:
Mr Killinger, the cover motif was created as part of a research project in which you were involved. Can you tell us what the project was about?
Sven Killinger:
The project was carried out with the transition system operator TransnetBW and thematically accompanied my dissertation work. The project objective was to develop a upscaling method using geographic information and actual PV installations in order to improve predictions of power output.
Why do we need projections or forecasts of PV power output?
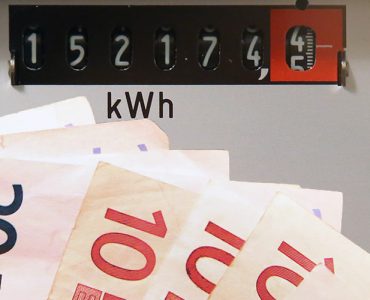
Grid operators have continual measurement data from only a small amount of the 1.7 million PV systems in Germany. Especially in the future energy system, the interaction between singular technologies becomes complex as the coupling of the electricity, heat, and mobility sectors comes into play. Then, a detailed overview of energy supply and demand becomes increasingly important. With advanced forecasting methods to determine the generated PV power, we can support grid operators by providing them a monitoring and control tool for secure grid operations management. With our approach, the available measurement values can be used to accurately estimate the PV power of all systems. Such exact forecasts are also extremely important for the commercial marketing on the electricity exchange.
Freiburg and the Region of Breisgau-Hochschwarzwald are Fraunhofer ISE’s home turf. Is that why you chose this area as a test location?
The grid territory lies in the region of our project partner Baden-Württemberg, and we favored a test location within the state. We chose Freiburg and the surrounding region due to its complex terrain, which is a particular challenge from a scientific point of view. The topography is characterized by a fast-changing terrain between mountains and valleys. This has an influence on the cloud cover and the solar irradiation. Good test results are a strong indication that even better results can be achieved in a more homogeneous region.
The photo shows the City of Freiburg and the locations of the installed PV systems. What do the size and color of the circles mean?
The circle area indicates the amount of installed power of each system. The color represents the tilt angle of the systems, which we determined using a GIS-based approach. The analyses showed that large systems often have a similar, mostly smaller, tilt angle. Small PV systems, mounted on residential buildings, tend to be tilted at a variety of different angles. Since the systems vary in dimension, tilt and orientation, they produce different amounts of electricity in the course of a day.
Video: Brief explanation of the forcasting model
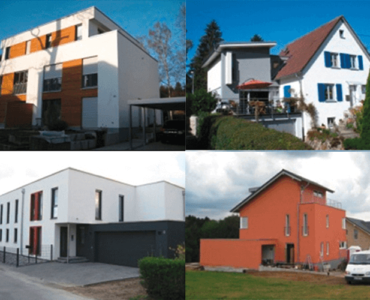
Since the beginning of 2000, PV systems have been installed increasingly on private and commercial buildings. Therefore, there should be reasonably current and accurate data available on the existing systems. What source did you use to collect the data?
One must distinguish between the different data. There is only a limited amount of continuous measurement data available for singular systems, as I mentioned before. We therefore use certain methods to estimate or quasi extrapolate the data for all of the systems. In order to estimate the power output of each system accurately, we require important system parameters like the tilt and azimuth angles. These are often unknown, however.
How do you determine these important parameters for each system?
The biggest challenge was locating all PV systems and finding out their parameters using an automated approach. First, the addresses from the system registry were transferred to geo-coordinates. Then, the exact location was identified using digital, publically available data from OpenStreetMap and different state offices. With this information, the orientation and tilt angle of each system could be determined. 95 % of the PV systems in the test region could be located and parameterized using this GIS-based approach. There were some special cases, such as PV systems without an exact address or flat roof systems, for which we applied a statistical approach.
Reference systems with real-time power data were selected and used as a basis for the estimate methods? How were these used to determine the performance of a large number of other PV systems?
PV systems actually very good measurement stations, since solar irradiation is the decisive factor for PV power output. The measured PV power can be used to determine irradiation data, which can then be used to estimate the power of all other PV systems. The prerequisite here is that the PV systems are located relatively close to each other and that the measurement values are representative. To ascertain that the data is representative, quality controls for the measurement values and tuning procedures were developed to balance out repeated shading by trees and other objects. After this is successfully carried out, the information from all of the 45 PV systems is combined and interpolated for the entire region to estimate the PV power from over 9000 systems in the region. The angles parameters determined using a GIS-based approach were considered in this analysis.
Which time horizon was addressed with the prediction method? Can it also forecast the next few hours?
Firstly, our objective in developing the measurement-based procedure was to provide the grid operators with real-time power generation data for their respective regions. We can also make use of solar radiation data from satellites images to improve the data basis. Assuming that the cloud conditions remain similar, relatively good results can be obtained for 30 to 60 minutes in the future. For a longer time frames (from several hours up to several days), we use predictions from weather models.
Can the developed method be used in any arbitrary region?
Yes, the data basis that we use is available throughout Germany and also in many parts of the world. This was an important criterion during the conception phase since we wanted that the developed methods be easily transferable to other locations. Currently, the digital data that is available, like 3-D city models, can simplify the use of this method and at the same time lead to even more accurate results.
Article image:
© Map imagery: Stadt Freiburg i. Br. – Vermessungsamt, „dl-de/by-2-0“, www.govdata.de/dl-de/by-2-0, Editing: Fraunhofer ISE


Add comment