

Technologies such as the IoT, artificial intelligence (AI), and big data can help buildings operate more efficiently and sustainably. Fraunhofer ISE is conducting research across various working groups on the application of AI and digitalization in the construction industry. What opportunities do these developments offer for a green transformation of the building sector? How can digital processes help address key challenges in the construction industry, such as the shortage of skilled workers and cost pressures?
Our interview with ISE digital researcher Simon Gölzhäuser takes the “Digital Buildings” series on our Innovation4E blog—which began as a three-part series—into its next phase.
You work in the “Cognitive Buildings” research group at Fraunhofer ISE. What are your main areas of focus?
I conduct research on methodologies for the efficient and automated digitization of building data, with a focus on building services, as well as their subsequent digital structuring and modeling. Especially in existing buildings, data on building services – like heating, ventilation and air conditioning systems (HVACs) – is in most cases incomplete and scattered across highly heterogeneous sources and formats, which often makes the initial assessment at the start of renovation projects or operational efficiency optimizations a laborious task. In addition, I focus on time series forecasting as well as data-driven system identification and control of building energy systems using neural networks. Digital system models can be helpful here, as they contain detailed knowledge about a system’s functions and topology.
Digital technologies offer great potential for the energy transition in the building sector. Which approaches excite you?
A major challenge in digitizing and structuring building data lies in how the collected information is digitally represented. The use of knowledge graphs as a data model, in conjunction with Semantic Web ontologies, offers great potential here. In a knowledge graph, entities appear as the nodes of the graph, while the edges represent the relationships between the entities. If the model includes, for example, a pipe connected to a pump, then the pipe and the pump each form a node in the graph. The relationship “is connected to” is in turn modeled by a directed edge from the “pipe” node to the “pump” node. In a dictionary-like manner, ontologies then provide clearly defined terms for the available entities and their relationships within a specific domain, e.g. for building energy systems.
What are the advantages of modeling building and facility information using knowledge graphs?
Digital information can not only be captured in a knowledge graph, but also semantically linked to one another in a machine-readable format. This results in a functional digital model of the facility within the context of building energy systems. This can be used for a wide variety of applications: For example, for automated verification of the system’s topology and the design of its components, or as a basis for control and fault detection algorithms in the context of monitoring and operational optimization. A functional system model in the form of a knowledge graph can also be used to create a digital twin of the system or the building. In conjunction with appropriate ontologies, this yields a uniform and standardized digital representation of the captured information that is reusable, expandable, and traceable. For existing buildings in particular, knowledge graphs thus offer the possibility of digitizing building data in a lean and flexible manner.
Your latest innovation is an AI-based app for digitizing system diagrams. How did this come about?
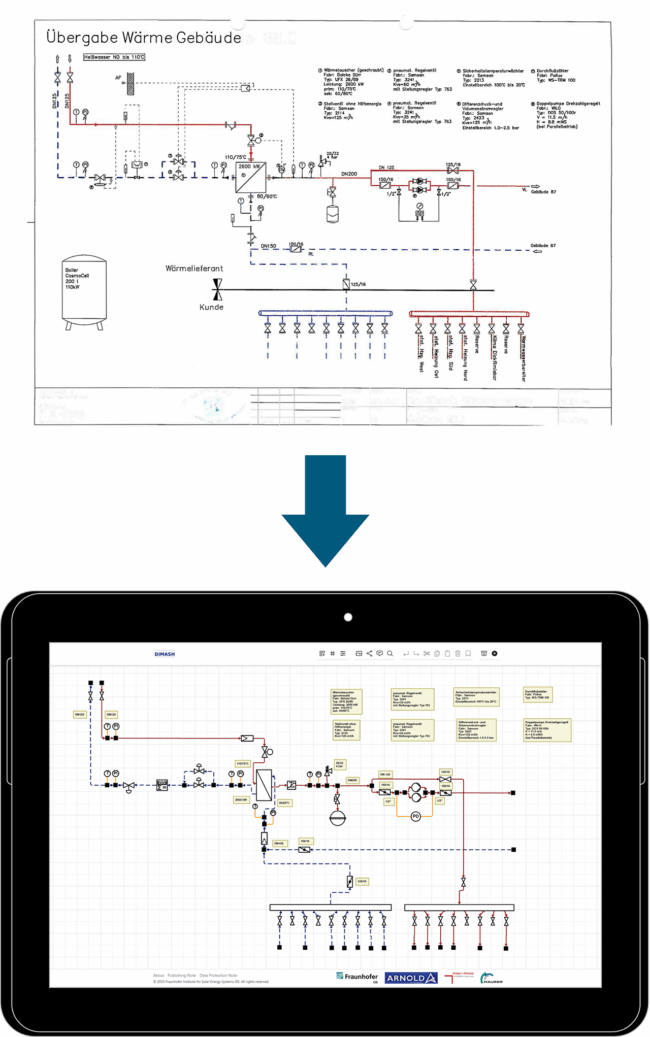
System diagrams (or P&ID diagrams) are an essential part of the documentation for building energy systems. They describe the layout of the installed systems as a schematic diagram and, in most cases, are available for existing buildings only as image files or PDFs, or even just in paper form. If a renovation or operational efficiency optimization is to be planned for a building, the system diagram must first be manually drawn into the appropriate software, which is a time-consuming manual process. This is exactly where we started with our “DiMASH” project.
How exactly does the app work?
We have developed AI-based algorithms and tools that use advanced Computer Vision and image processing techniques to scan a system diagram and convert the content into a digital model of the system with minimal user interaction. The captured data is structured as a knowledge graph based on an ontology also developed within the project, which consolidates and extends the concepts of publicly available ontologies established in the field of application. The digital system model can then be further edited in the app and, for example, directly linked to time-series data from a monitoring system.
You want to continue developing the app in collaboration with software manufacturers. What is the added value for future partners and end customers?
For end customers, such as engineering design offices, our prototype and the AI-based digitization pipeline it contains offer significant time savings during the stocktaking process, which can reduce overall job processing time and increase throughput. Potential partners from the software industry, such as manufacturers of relevant CAD design software, can offer their customers unique functionality with significant added value by integrating the tools developed in “DiMASH” into their portfolio.
Where do you see further room for development?
In current and future projects, we aim to further explore the potential of Large Language Models (LLMs) for capturing, digitizing, and processing unstructured building data. In addition to system diagrams, there are many other diverse sources of information regarding building energy systems and buildings in general. One example is data point lists. These are tables that describe all measured values and control variables of a system, such as temperature sensors or valve positions. These tables each follow specific naming conventions, for which, however, there are no universal standards established. This means that the information required to set up system monitoring usually must be tracked down manually and assigned to the correct system components. In the “GraphEET” project, we are therefore investigating how monitoring processes can be automated based on data point lists and related documentation using LLMs and knowledge graphs.
Title photo: © iStock.com / Henvry


Add comment